Soc 880 Fall 2015
Curve Rate of Change Example
Kieran Healy
Duke University
This is from an example by William Cleveland. Independent of the aesthetic quality of a graph, some perceptual features are hard to fight against. E.g., assessing rates of change in two curves.
Consider the following. (Run this interactively in an R session and pop up a plot window with the results.)
x <- seq(0, 8, 0.001)
y <- x^4
y1 <- (x^4) + 400

plot(x, y, type="l")
lines(x, y1, type="l")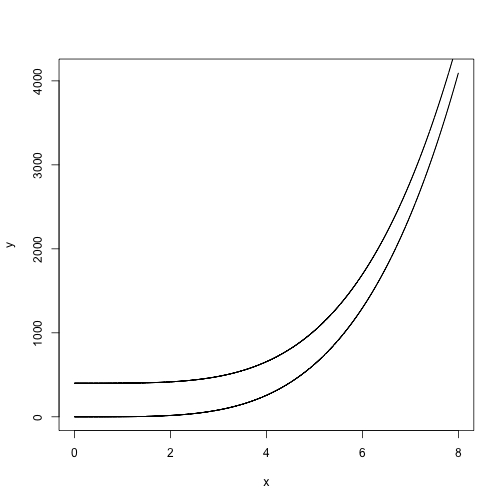
plot of chunk curves
Once you’ve got the plot in a graphics window, take a look at the apparent rate of change between the two curves. Then drag the window so that it’s six or seven times wider, but not any taller. Now how do the curves compare?
plot(x, y, type="l")
lines(x, y1, type="l")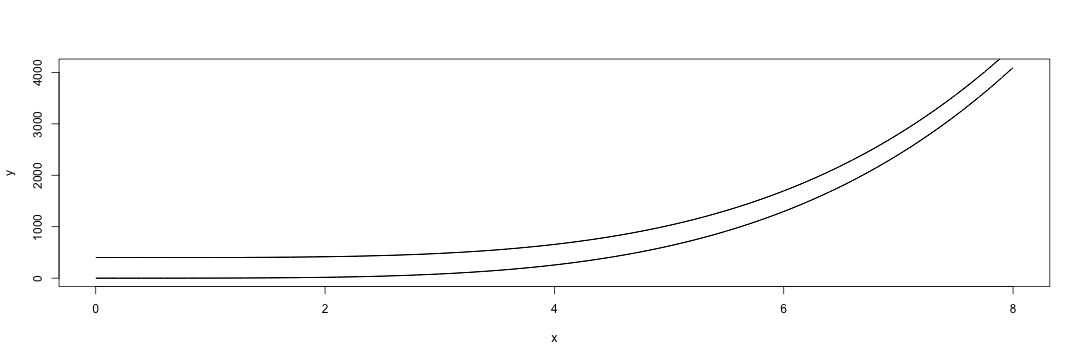
plot of chunk curves-2